OKM Visualizer 3D Studio Explained for Beginner
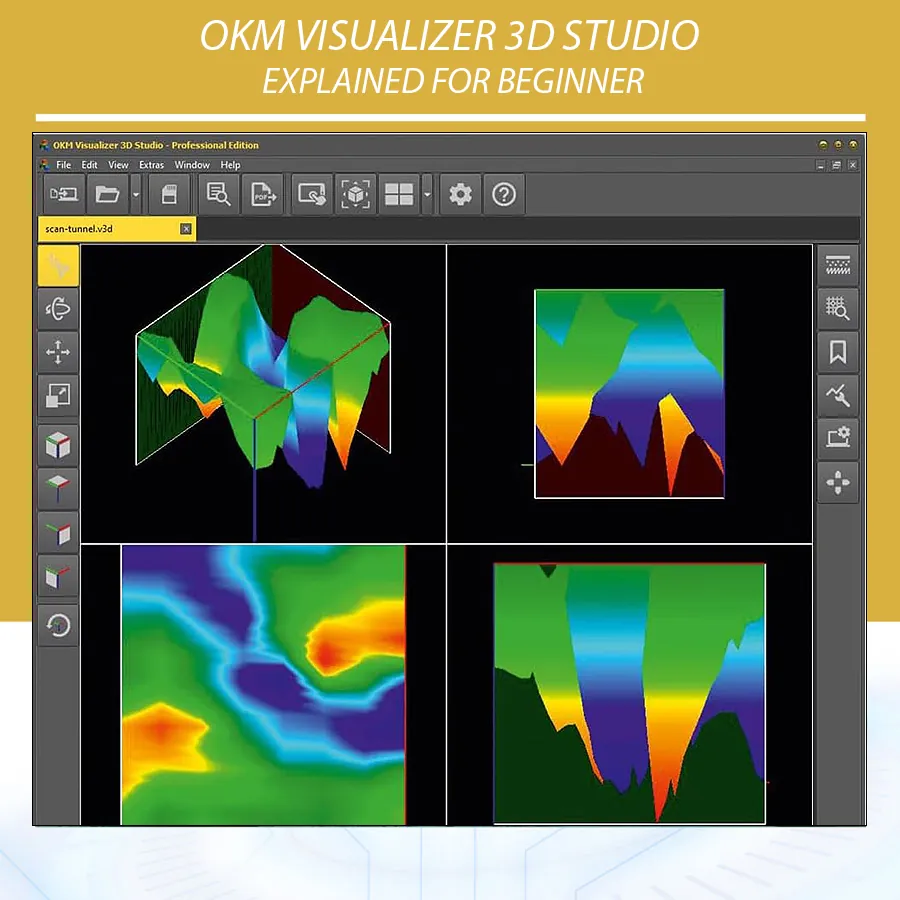
OKM Visualizer 3D Studio is one of the most important software tools for users who work with OKM 3D ground scanners. For a beginner, the software can look impressive and confusing at the same time: colorful peaks, depressions, side views, top views, soil options, measured values, bookmarks, scan information, and reporting tools. The mistake many new users make is treating the first colorful 3D image as a direct underground photo. It is not a camera image. It is a visual interpretation of measured ground data.
This guide explains OKM Visualizer 3D Studio in clear beginner language. It is written for users who want to understand what they are looking at after a scan, how to avoid false conclusions, and how to build a more professional reading workflow. The article is especially useful for buyers or users of OKM devices available through Orient Detectors, including OKM eXp 7000 and OKM Rover C4.
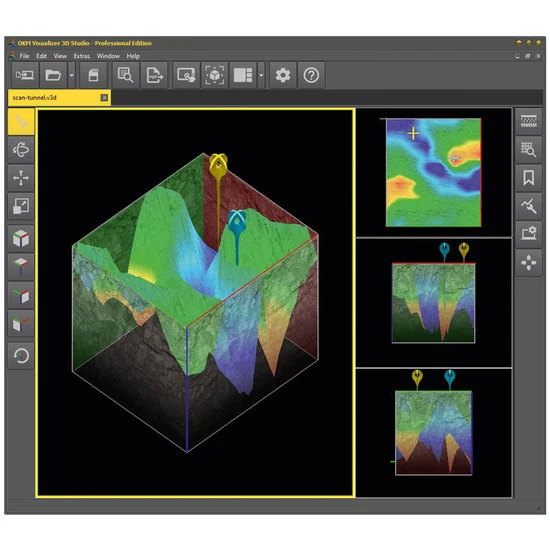
The most important idea is simple: OKM Visualizer 3D Studio helps you organize evidence. It does not make the final decision alone. A good result depends on correct scanning, correct soil settings, clean field technique, repeated confirmation, and careful interpretation. Once you understand that, the software becomes much easier to use.
What Is OKM Visualizer 3D Studio?
OKM Visualizer 3D Studio is analysis software for 3D ground scan data collected with compatible OKM devices. Instead of giving only a sound or a number, the software displays scan measurements as a visual map. Depending on the scan and device, the user can inspect shape, position, estimated depth, signal intensity, and the relationship between suspicious anomalies and the surrounding ground.
OKM documentation describes Visualizer 3D Studio as a tool for importing scan data, viewing it in different perspectives, adjusting the visualization, setting soil type, selecting measured values, adding bookmarks, using modifiers, and exporting reports in professional workflows. For beginners, these features should be learned step by step. You do not need to master every advanced tool on the first day. You do need to know what must be checked before believing a result.
In the Orient Detectors catalog, OKM scanners are relevant for users who need advanced underground analysis, not just ordinary coin or surface target detection. The OKM eXp 7000 3D ground scanner is a professional example because it supports operating modes such as 3D Ground Scan, Magnetometer, Live Scan, Mineral Scan, Tunnel Scan, Pinpointer, 3D VLF Scan, and VLF Metal Detection. Visualizer 3D Studio gives the user a desktop-style analysis environment for reviewing the scan more carefully.
What Beginners Should Understand First
A 3D scan result is a measurement map. It is not proof by itself. A red peak, blue depression, or large colored shape may be caused by a real buried object, a cavity, disturbed soil, mineralization, surface iron, wrong scanning technique, wrong scan dimensions, or incorrect soil selection. Beginners often focus only on color, but professionals read the whole scan: shape, position, repeatability, size, depth estimate, surrounding values, scan direction, and field notes.
Before interpreting any OKM Visualizer 3D Studio result, ask these questions:
- Was the scan grid straight and measured correctly?
- Was the probe held at a stable height?
- Were the scan lines parallel and evenly spaced?
- Was the correct soil type selected?
- Was the area cleared of surface iron before scanning?
- Does the anomaly repeat when scanned from another direction?
- Does the shape make sense for the expected target?
- Can the result be confirmed with another mode or detector?
These questions matter because the software can only visualize the data it receives. If the field scan is poor, the software may display a poor result beautifully. A clean scan is the foundation of a clean interpretation.
Beginner Workflow: From Field Scan to Software Reading
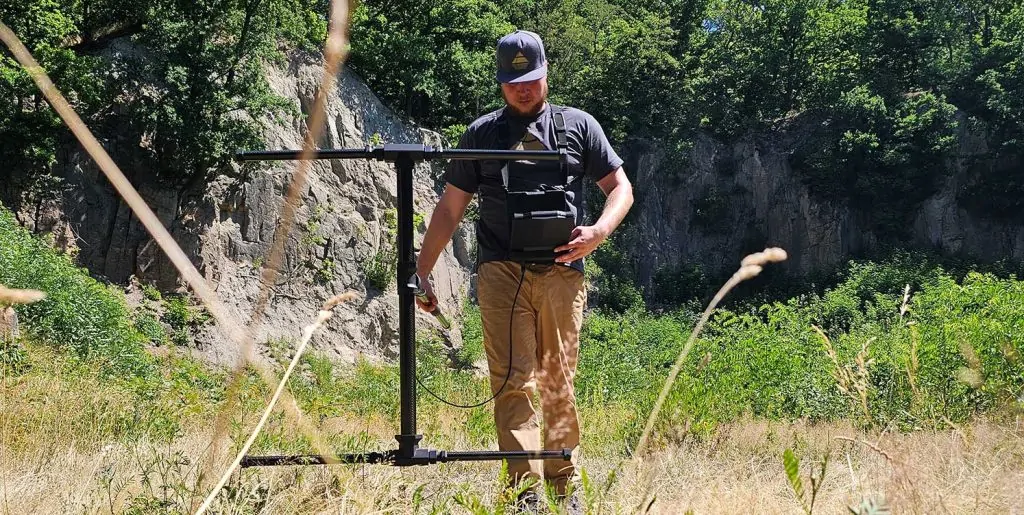
A reliable OKM Visualizer 3D Studio workflow starts before the scan is imported. The operator should prepare the scan area, remove obvious surface metal, define the grid, choose the scanning direction, and record the soil condition. The cleaner the field routine, the easier the software becomes.
| Step | What to Do | Why It Matters |
|---|---|---|
| 1 | Prepare the scan area and remove visible surface metal | Surface iron can create strong false anomalies |
| 2 | Measure the scan field and mark corners | Wrong field dimensions distort position and size |
| 3 | Walk straight scan lines at a steady pace | Uneven walking creates stretched or shifted targets |
| 4 | Import the scan into OKM Visualizer 3D Studio | The software needs correct field information for analysis |
| 5 | Select the proper soil type | Soil settings influence depth estimation and visualization |
| 6 | Rotate, zoom, and inspect multiple views | A real anomaly should make sense from more than one angle |
| 7 | Mark important areas with bookmarks | Bookmarks organize evidence for reporting and rechecking |
| 8 | Repeat or confirm the scan | Repeatability is one of the strongest signs of reliability |
Scan Information: The First Screen Beginners Should Check
When you open a scan in OKM Visualizer 3D Studio, do not jump immediately to the most dramatic 3D angle. First check the scan information. This may include field length, field width, scan direction, impulse mode, number of scan lines, number of measured points, and other technical details depending on the device and software version.
This information is not boring paperwork. It controls how the scan is displayed. If you entered the field as 10 meters long but actually walked 7 meters, the software may stretch the anomaly. If the scan lines were uneven, the target may appear wider or narrower than reality. If the wrong scan direction is assumed, the anomaly may be interpreted in the wrong part of the field.
For a beginner, the scan information page is the first quality check. If the scan setup is wrong, fix the interpretation before making any field decision. A professional report should always include scan dimensions and direction so another user can understand how the result was produced.
Why Soil Type Matters in OKM Visualizer 3D Studio
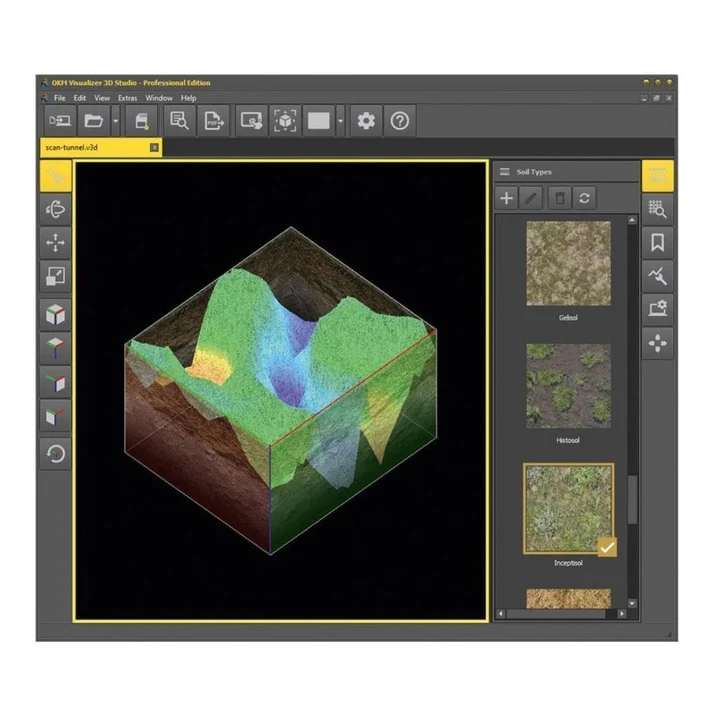
Soil type is one of the most important settings in OKM Visualizer 3D Studio. Different soils behave differently. Dry sand, wet soil, clay, rocky ground, mineralized soil, and compacted earth can influence signal behavior and depth estimation. External detector education resources, such as Garrett’s explanation of ground mineralization and metal detectors, show why mineral content can affect detector responses.
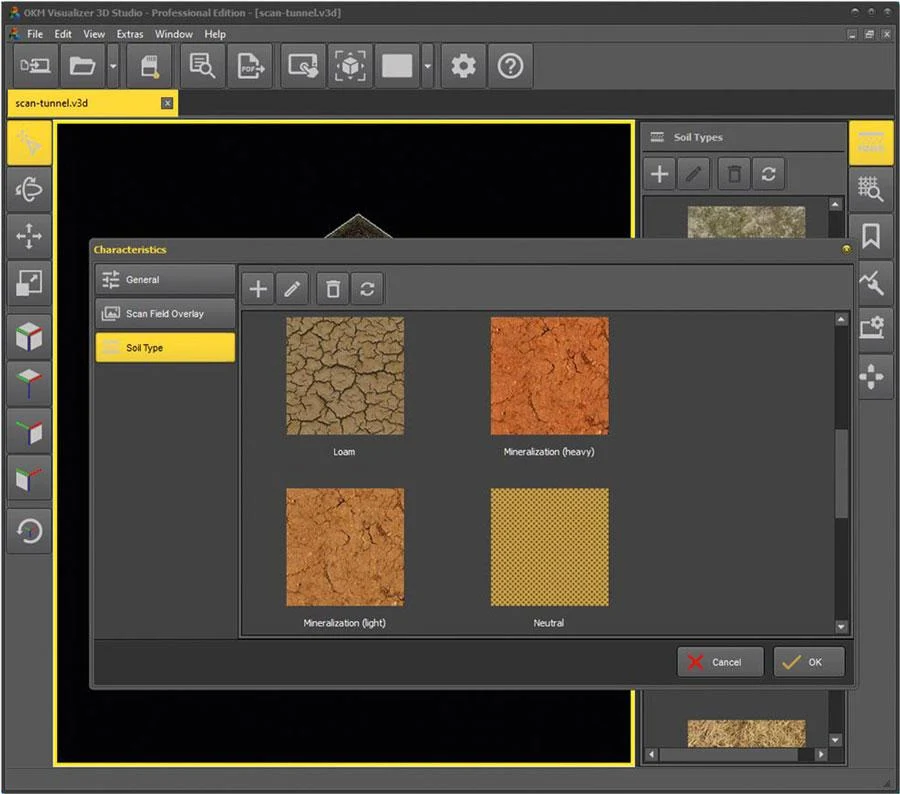
In 3D scan software, soil type is especially important because the software may use it when estimating depth. If the soil type is wrong, the target may appear deeper or shallower than it really is. Beginners should avoid presenting a depth number without mentioning the soil setting. A better phrase is: “The software estimates the anomaly at approximately this depth using the selected soil type.” That is more honest and more professional.
Understanding Colors Without Overreacting
Color is useful, but color alone is not enough. In many 3D scan workflows, warm colors may indicate stronger or positive responses and cooler colors may indicate lower responses or possible void-like areas. But every device and software ecosystem may use its own color logic. OKM Visualizer 3D Studio should be read according to OKM documentation and the specific device workflow, not according to a generic internet color chart.
The beginner mistake is to say “red means gold” or “blue means tunnel” without checking shape, values, depth, and repeatability. A red peak may be a metal object, but it may also be surface iron or a scanning error. A blue depression may indicate a lower-response area, but it may also come from poor walking or a natural ground change. Colors are clues. They are not final verdicts.
Shape: The Most Important Visual Clue
After checking scan information and soil type, look at shape. A real buried object usually has a coherent shape. It may be compact, centered, and repeatable. A tunnel-like anomaly may have length and direction. A room-like cavity may appear as a broader structured area. Mineralization often appears as irregular, spread-out, or inconsistent color changes across the scan.
Use the software’s rotation and view controls to inspect the anomaly from different angles. If a target looks convincing only from one dramatic perspective but disappears or becomes meaningless from the top or side view, be careful. Real field interpretation should survive several views.
Depth: Useful, but Approximate
OKM Visualizer 3D Studio can support depth estimation, but beginners should treat depth as approximate. Depth depends on correct scan dimensions, soil type, target size, target orientation, sensor height, signal strength, and clean data. A small target at shallow depth and a large target deeper down can sometimes produce confusing visual impressions.
When reporting depth, avoid saying “the target is exactly 2.4 meters deep.” A better professional wording is: “The software indicates an estimated depth around 2.4 meters, assuming the scan dimensions and soil setting are correct.” This protects the user from overconfidence and makes the report more credible.
Using Bookmarks Like a Professional
Bookmarks are useful in OKM Visualizer 3D Studio because they allow the user to mark important areas in the scan. A beginner may use bookmarks simply to point at a colorful spot. A professional uses bookmarks to record observations.
Good bookmark notes might include:
- Compact positive anomaly near the center of scan line 4.
- Possible void-like low response at rear-right quadrant.
- Broad mineralized response across left side; repeat scan recommended.
- Strong surface-like signal; inspect with magnetometer or detector before digging.
- Target appears near field edge; extend scan area and repeat.
This style turns OKM Visualizer 3D Studio from a display tool into a documentation tool. It also helps dealers, trainers, and field teams explain results to customers more clearly.
Modifiers and Adjustments: Helpful, but Use Carefully
Visualizer software often includes tools that can change how scan data appears. These tools may help clarify weak details, improve viewing, or make an anomaly easier to inspect. But they can also make a weak result look more dramatic if used carelessly. A beginner should always compare the modified view with the original scan.
A good practice is to save or screenshot the original view first, then apply adjustments for analysis. In a report, mention that a modified view was used. Do not present a heavily adjusted picture as raw evidence. Professional interpretation depends on transparency.
Common Beginner Mistakes
Mistake 1: Believing the First Image Immediately
The first view may be exciting, but it is only the beginning. Rotate, inspect, compare, and repeat before making a decision.
Mistake 2: Ignoring Surface Iron
Small iron objects near the surface can create strong readings. Use magnetometer tools or a conventional detector to clean the area when possible.
Mistake 3: Wrong Soil Type
Depth estimation can shift when the soil setting is wrong. Always choose the closest real soil type and mention it in your notes.
Mistake 4: Scanning Too Fast
Fast, uneven movement produces poor data. Walk steadily and keep the probe height consistent.
Mistake 5: Reading Color Without Shape
A color patch is not enough. Look for coherent shape, clear boundaries, reasonable depth, and repeatability.
How OKM Visualizer 3D Studio Fits With OKM Devices
OKM eXp 7000 is a strong example of a device that benefits from software-based interpretation. It supports multiple operating modes, including 3D Ground Scan, Magnetometer, Live Scan, Mineral Scan, Tunnel Scan, Pinpointer, 3D VLF Scan, and VLF Metal Detection. These modes do not all answer the same question. Magnetometer can help inspect or clear ferrous surface targets. Live Scan can provide immediate feedback. Tunnel Scan is more relevant for void-type investigation. 3D Ground Scan is used for structured scan data and software analysis.
OKM Rover C4 also belongs in this professional scanning category. Users who choose these devices usually want more than a simple beep. They want to inspect possible buried structures, cavities, treasures, mineralized zones, or deep anomalies. OKM Visualizer 3D Studio becomes the place where that data is reviewed carefully.
Beginner Interpretation Checklist
Before you recommend excavation based on OKM Visualizer 3D Studio, run through this checklist:
- Scan dimensions are correct.
- Scan direction is documented.
- Soil type is selected and noted.
- Probe height was stable during scanning.
- Anomaly is not only on the edge of the field.
- Anomaly has a logical shape.
- Depth estimate is realistic for the target size.
- Result was inspected from top, side, and 3D views.
- Surface iron was checked or removed.
- A repeat scan supports the original result.
- Another mode or detector confirms the area when possible.
How to Read Different Views in OKM Visualizer 3D Studio
One reason OKM Visualizer 3D Studio is useful for beginners is that it allows a scan to be inspected from more than one angle. A single view can be misleading. A dramatic perspective view may make a small surface response look like a large underground object. A top view may show where the anomaly is located inside the field, but it may not show depth behavior clearly. A side view can help the user understand whether the response appears shallow, deep, raised, depressed, compact, or stretched.
Start with the top view. This view is the easiest way to locate the anomaly in the scan field. It helps answer simple questions: Is the suspicious area near the center? Is it close to the edge? Does it occupy one scan line only, or does it appear across several lines? A target that appears only on one line may be weaker evidence than a target that appears coherently across nearby lines.
Then move to the side view. Side views are helpful for judging whether the anomaly has vertical strength or whether it is only a flat color change. If a suspected metal target appears as a compact raised response from several angles, it becomes more interesting. If a suspected cavity appears as a consistent depression or low-response zone, it deserves a repeat scan. If the shape changes completely when you rotate it, your confidence should decrease.
Finally, use the 3D perspective view for general understanding, not final proof. It is excellent for presentations and quick visual explanation, but it should be supported by the top and side views. Professional users rarely rely on the most beautiful screenshot. They rely on the view that explains the data most clearly.
How to Build a Simple Beginner Report
Even if you are not creating a formal customer report, it is useful to document your OKM Visualizer 3D Studio reading. A simple report helps you compare scans, explain your decision later, and avoid forgetting field details. It also makes your work look more professional when discussing results with a team or dealer.
| Report Item | What to Write |
|---|---|
| Device and probe | Write the OKM device model and sensor/probe used. |
| Scan field | Record length, width, scan direction, and number of lines. |
| Soil condition | Mention dry, wet, rocky, sandy, clay, or mineralized ground. |
| Main anomaly | Describe its location, shape, color behavior, and size impression. |
| Depth estimate | Write it as approximate and mention the selected soil type. |
| Confidence level | Use low, medium, or high confidence based on repeatability and confirmation. |
| Next action | Recommend repeat scan, magnetometer check, detector confirmation, or cautious excavation. |
This habit is especially valuable for users of high-end OKM scanners because many search sites are revisited. A result that seems unclear today may become more meaningful after a repeat scan, a different probe, or a second operator confirms the same area.
When to Repeat the Scan
Beginners sometimes think repeating a scan is a sign that the first result failed. In professional work, repeat scanning is normal. You should repeat the scan when the anomaly is important, when the result sits near the edge of the field, when the shape is unclear, when the ground is highly mineralized, or when excavation would require serious effort.
A good repeat scan can be done in several ways. You can scan the same field again from the same direction to check whether the result repeats. You can scan from the opposite direction to test whether the anomaly stays in the same position. You can expand the grid so the anomaly is no longer on the edge. You can reduce line spacing to improve detail. Each repeat adds information.
If an anomaly disappears in every repeat scan, treat it cautiously. If it appears again in the same location with a similar shape, your confidence improves. If it shifts dramatically, check your grid measurement, sensor height, and scan direction before interpreting it as a moving target.
FAQ: OKM Visualizer 3D Studio
Is OKM Visualizer 3D Studio easy for beginners?
It can be learned by beginners, but it requires patience. Start with scan information, soil type, view controls, and basic shape reading before using advanced tools.
Can OKM Visualizer 3D Studio identify gold with certainty?
No software should be treated as absolute proof of gold. It can show anomalies and help with interpretation, but repeat scans and confirmation with other modes are important.
Why do two scans of the same place look different?
Different walking speed, probe height, scan direction, soil moisture, line spacing, and start point can change the result. Repeatability improves confidence.
Should beginners use modifiers?
Yes, but carefully. Compare modified views with the original scan and avoid making a weak result look stronger than it really is.
Final Advice
OKM Visualizer 3D Studio is powerful because it turns ground measurements into a visual workflow. But the software is only as reliable as the scan behind it. Beginners should focus less on dramatic colors and more on disciplined interpretation: correct field data, correct soil type, stable scanning, multiple views, measured values, bookmarks, repeat scans, and confirmation.
Used correctly, OKM Visualizer 3D Studio helps users move from guessing to structured evidence. That is the difference between looking at a colorful image and reading a professional 3D ground scan.
Resources
- Orient Detectors: OKM eXp 7000
- Orient Detectors: OKM Rover C4
- OKM Detectors: Visualizer 3D Studio documentation
- OKM Americas: Visualizer 3D Studio software
- OKM Americas: eXp 7000 Professional Plus
- Garrett: Ground mineralization and metal detectors
- Orient Detectors: How to Read 3D Ground Scan Results Like a Professional