How to Read 3D Ground Scan Results Like a Professional
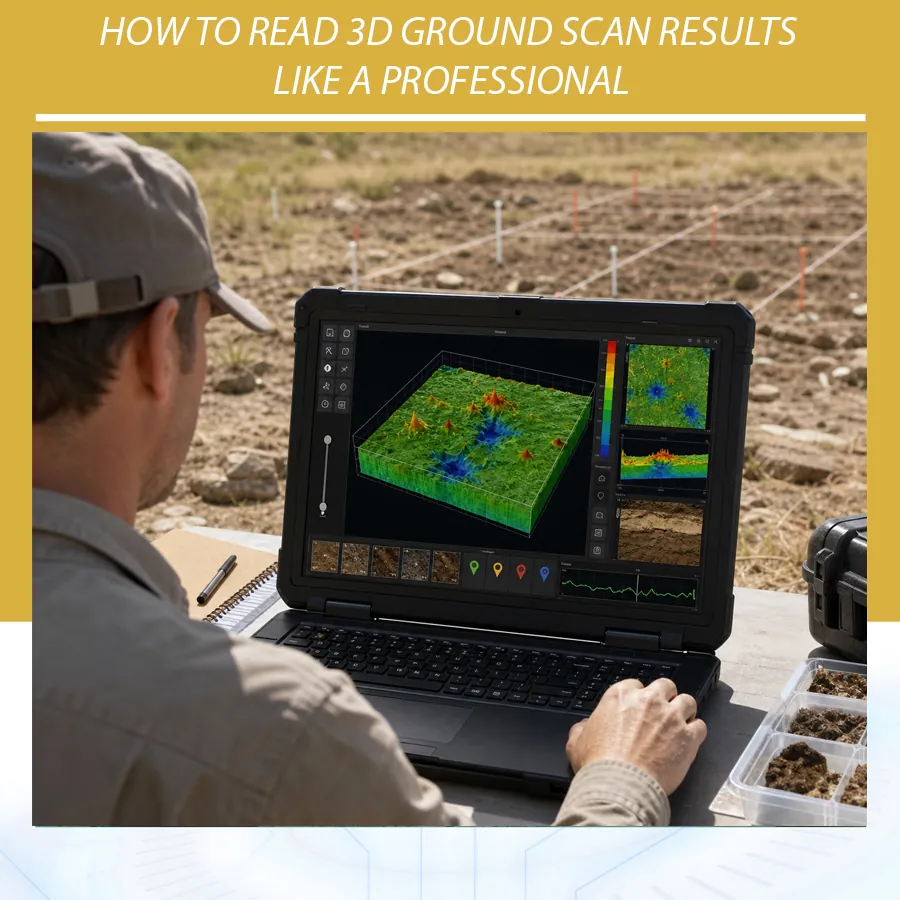
Reading 3D ground scan results is one of the most important skills in professional treasure hunting, archaeological-style site investigation, cavity detection, and deep target evaluation. A 3D ground scanner can show colors, peaks, depressions, slices, grids, signal values, estimated depth, and target-like shapes, but the image is not an automatic answer. It is measured data that must be interpreted with discipline.
Many beginners look at a scan and immediately ask, “Is this gold?” or “Is this a tunnel?” Professionals ask better questions first: Was the scan grid straight? Was the probe height stable? Was the soil type entered correctly? Does the anomaly repeat from another direction? Does the color pattern match the expected target? Is the shape consistent with a buried object, disturbed soil, mineralization, or a void? Good interpretation starts before the scan is even displayed.
This guide explains how to read 3D ground scan results using practical examples from devices available on Orient Detectors: Phoenix, Gold Vision, GR-4 GroundTech, Mega Scan Pro, and OKM EXP 7000. It also explains the software ecosystems behind these devices, including Multi Visual Analyzer, GEOGROUND 3D Analyzer, G-Portal, and OKM Visualizer 3D Studio.
What Are 3D Ground Scan Results?
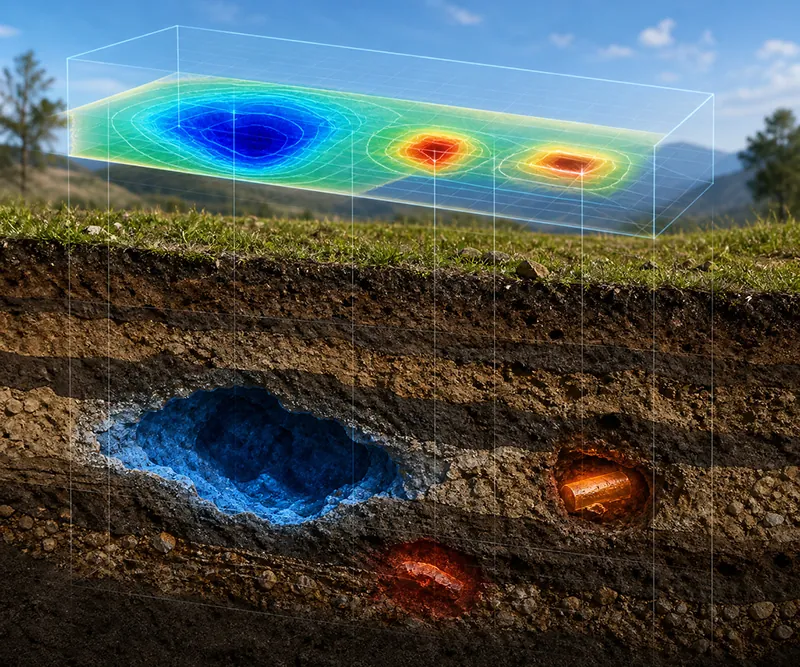
3D ground scan results are visual representations of measurements collected from the ground. Depending on the device, these measurements may come from magnetic sensors, gradiometers, ground scanning probes, VLF scan systems, live scan tools, or multi-sensor scanner arrays. The software converts those values into a 2D grid, 3D graphic, color map, profile, or report that helps the operator understand what may be under the scan area.
A professional interpretation does not treat the image as a photograph of the underground. A 3D scan is not a camera. It is a visualization of measurement differences. A metal object may appear as a raised colored anomaly. A cavity may appear as a depression, blue zone, or low-response anomaly depending on the system. Mineralized ground may create wide irregular patterns. Operator error can create lines, streaks, gaps, or artificial peaks.
The key is to read scan data as evidence. One scan suggests a possibility. Repeated scans from multiple directions build confidence. Confirmation with another mode, such as live scan, pinpointer, pulse induction, VLF metal detection, or a second grid scan, turns a possibility into a more reliable decision.
Professional Interpretation Starts Before the Scan
Most bad 3D ground scan results are created during scanning, not during software analysis. If the operator walks unevenly, changes probe height, rotates the sensor, scans over surface metal, uses the wrong soil type, or builds an irregular grid, the final image may look exciting but be misleading.
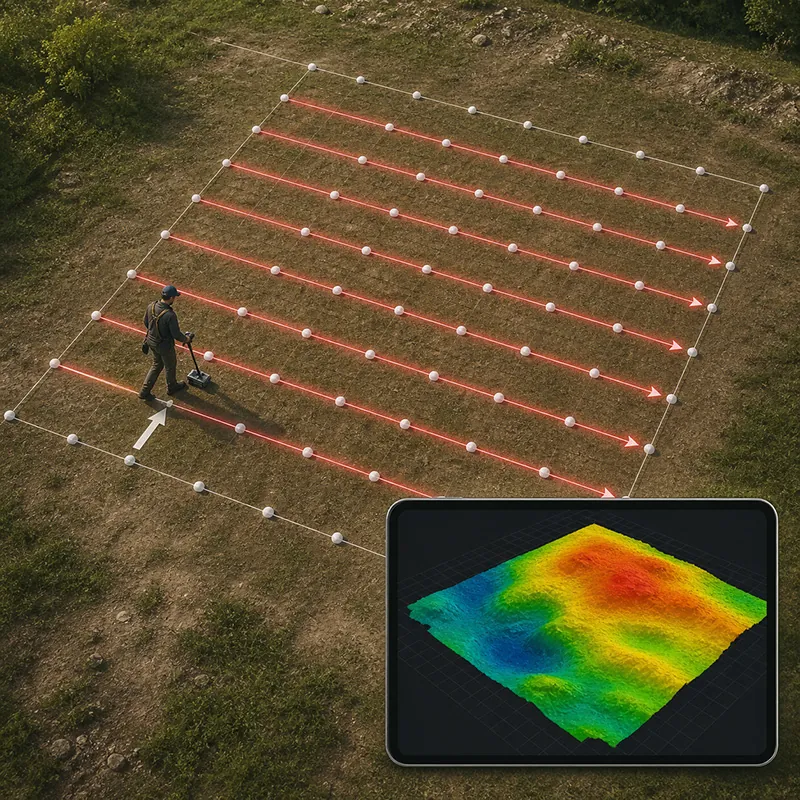
Before scanning, remove obvious surface metal when possible. Do not scan beside vehicles, fences, tools, phones, or power cables. Mark the scan area with visible corners. Keep line spacing consistent. If the system uses manual scan points, record each point carefully. If it uses automatic scan points, walk at a steady rhythm. Keep the probe or scanner at the same height from the ground throughout the scan.
Mega Scan Pro’s manual, for example, describes a structured grid workflow for Ground Scan, including scan mode, scan path, scan area width, scan area height, and starting point. It also recommends rectangular scan areas such as 3 x 3, 6 x 6, or 9 x 9 meters, with consistent scan point spacing. This is the mindset professionals use: the quality of the image depends on the quality of the survey.
The Five Questions Professionals Ask First
1. Is the scan technically clean?
Look for repeated line errors, sudden edge spikes, strange diagonal streaks, or unrealistic blocks of color. These often point to walking error, wrong start direction, inconsistent probe height, or surface interference.
2. Is the anomaly isolated or spread across the whole area?
A real target is often localized. A broad noisy pattern across the full scan may indicate mineralization, soil change, moisture, or poor calibration.
3. Does the shape match the expected target?
A small metal object should not look like a large room. A tunnel-like anomaly should show length and direction. A treasure box may appear compact and structured. A disturbed soil patch may be irregular.
4. Does it repeat from another direction?
One scan is not enough for excavation. Repeat the scan from the opposite direction or a slightly shifted grid. Professional users compare results before deciding.
5. Can another system confirm it?
If a device has live scan, pinpointer, PI detector mode, VLF metal detection, or long-range systems, use them as confirmation layers. Strong 3D ground scan results should survive cross-checking.
Understanding Color Logic in 3D Scans
Color systems vary by device, so never assume every app uses the same exact color meaning. Still, many 3D ground scanners use a basic logic: normal ground is often green or neutral; metals may appear yellow, orange, red, or raised; cavities or voids may appear blue or lowered; mineralized or disturbed zones may appear as inconsistent color transitions.
The color-indicator guide supplied with this article gives a practical target discrimination model that helps users move beyond “red means target” and into actual value comparison. In that guide, blue represents voids, while red represents metallic categories such as iron, valuable metals, and gold. The important point is that the green value shown in the visual image is not treated as the key indicator. Instead, the user compares the closest blue value with the red value and checks whether the resulting difference is strong enough to count as a valid target.
| Indicator | Color | Value Range | Professional Reading |
|---|---|---|---|
| Void / cavity | Blue | 0 to 90 | Possible empty space, cavity, tunnel, room, grave-like void, or low-response area. |
| Iron | Red | 110 to 160 | Possible ferrous metal or iron-rich response; check with magnetometer or iron discrimination when available. |
| Valuable metal | Red | 160 to 190 | Possible non-ferrous or valuable metal response, but confirmation is still required. |
| Gold | Red | 190 to 230 | Possible strong precious-metal or gold-category response depending on the device and scan quality. |
The supplied guide also shows a simple validation rule: subtract the closest blue value from the red value. If the result is greater than 30, the anomaly is more likely to be a valid target response. If the result is 30 or less, the reading should be treated as weak, questionable, or not sufficient by itself.
For example, a red value of 152 beside a blue value of 51 gives a difference of 101, which passes the greater-than-30 rule. A red value of 161 beside a blue value of 39 gives 122, also strong. But a red value of 199 beside a blue value of 184 gives only 15, which fails the rule even though the red number itself looks high. This is a critical lesson for reading 3D ground scan results: an impressive color alone is not enough. The contrast between the target response and its nearest low-response reference matters.
The same principle helps prevent overreading attractive shapes. A red triangle, block, sloped object, or irregular polygon can look convincing on screen, but the shape should still be checked with the red-minus-blue value difference. If the difference is greater than 30 and the anomaly keeps the same location, size, and shape after a repeat scan, confidence improves. If the difference is below the threshold or changes drastically after rescan, the result may be mineralization, handling error, or weak contrast rather than a reliable buried target.
Phoenix and Mega Scan Pro use the Multi Visual Analyzer ecosystem and show color-coded results for ground scan interpretation. Orient Detectors’ Phoenix page lists a color logic where green indicates normal ground, light blue indicates a small cavity, blue indicates a cavity, yellow indicates metal objects, and red indicates gold. Mega Scan Pro’s manual uses a similar practical color approach: green for normal natural ground, light blue for small cavity, blue for large voids such as tunnels, yellow for small metal object, and red for gold or large metal target.
Gold Vision adds another visual layer through its Smart Sensor LED color feedback. The manual states that red indicates metals, blue relates to voids or cavities, and green indicates normal ground. Its GEOGROUND 3D Analyzer app then provides the full visual analysis of scanned data. GR-4 and GR-4 DUAL use G-Portal and display colored 3D/4D graphics for metals, spaces, structures, and differences. OKM Visualizer 3D Studio provides extensive tools for rotating, scaling, viewing, selecting values, assigning soil types, bookmarking, applying modifiers, and exporting reports.
How to Apply the Red Minus Blue Rule in the Field
When reviewing 3D ground scan results, identify the strongest red zone first, then locate the closest blue value near that anomaly. Do not compare red with a distant blue value from the other side of the scan, because that may represent a different soil condition. Use the nearest relevant contrast point. Then subtract blue from red. A result greater than 30 supports a valid target reading; a result below or equal to 30 means the color contrast is too weak for confident interpretation.
This method is especially useful when the operator sees mixed colors around a possible target. Many real scan maps contain gradients, not perfect blocks of color. If the red zone is surrounded by blue or low values and the difference is strong, the anomaly deserves closer inspection. If red and blue values are almost equal, the scan may be showing background variation rather than a distinct buried object.
Raised Peaks vs Depressions: Metal or Void?
Many users think every strong shape in 3D ground scan results means treasure. That is not correct. A raised, compact, high-response anomaly is more likely to suggest metal or a strong mineralized object, depending on the device. A depression, low-response zone, or blue-toned anomaly may suggest a cavity, tunnel, grave-like void, room, or soft disturbed area. But the software must be read in context.
A compact red or yellow anomaly inside otherwise normal ground may be more interesting than a wide irregular red area across half the scan. A neat blue tunnel-like line is more meaningful than random blue patches caused by inconsistent probe height. A target shape that appears in the same location after a control scan is more reliable than a dramatic one-time spike.
Professional interpretation is about pattern consistency. You are not hunting colors; you are hunting repeatable anomalies that make physical sense.
How to Read Size, Shape, and Depth
3D scan software may estimate position, size, shape, and depth, but these values depend on correct scan dimensions and soil settings. If the scan area is entered as 9 x 9 meters but the operator actually walked 7 x 8 meters, the target position and size will be wrong. If the soil type is wrong, depth estimation can shift.
OKM Visualizer 3D Studio specifically emphasizes scan field information, soil type selection, and analysis tools. OKM says its software can help determine position, size, and depth more precisely after measurement, and it allows users to adjust views, use predefined viewports, add bookmarks, apply modifiers, select measured values, and export reports. This is why serious users do not stop at the first 3D view. They rotate, inspect, compare, and document.
Depth should always be treated as an estimate, not an absolute promise. Large targets are easier to evaluate at depth than small objects. Soil structure, moisture, mineralization, scanning speed, grid quality, and target orientation affect results. A professional report should include “estimated depth” and “confidence level,” not just “target at X meters.”
Device and App Workflows
Phoenix with Multi Visual Analyzer
Phoenix is a Mega Detection 3D ground scanner with three search systems: 3D Ground Scan, Live Stream, and Pin Pointer. Orient Detectors describes Phoenix as using M.G.S Multi Ground Scanner and V.S.T Vertical High Signal Transceiver tools. The 3D Ground Scan system can display 2D visualization on the device screen or 3D graphics on an Android tablet through Multi Visual Analyzer.
When reading Phoenix 3D ground scan results, start with the scan method. M.G.S is designed to cover larger areas with multiple sensors, so its value is fast area mapping. Use it to identify suspicious zones. Then use Live Stream for real-time feedback and Pin Pointer for closer localization. In Multi Visual Analyzer, treat red/yellow zones as potential metal responses and blue/light-blue zones as possible cavities, but confirm the pattern by rescanning.
Phoenix is useful when the user needs fast visual scanning for gold, metallic targets, antiquities, caves, tunnels, or voids. The professional workflow is: prepare a clean area, perform a structured ground scan, review the color map, repeat from a second direction, then use Live Stream or Pin Pointer to refine the result.
Mega Scan Pro with Multi Visual Analyzer
Mega Scan Pro uses Ground Scan, Pin Pointer, Auto LRL, Manual LRL, Ionic, and Bionic systems. The Ground Scan system uses the V.S.T probe to record measurements across scan lines and scan points. According to the manual, results can appear as a 2D visualization on the device or as a 3D visualization on an Android tablet using Multi Visual Analyzer.
Professionals read Mega Scan Pro results by paying attention to grid discipline. The manual describes Manual and Automatic scan modes, One Direction and Zigzag paths, scan width, scan height, starting point, and saved scan files. It also notes that each cell in the grid represents a scan point. That means scan quality depends on a steady probe height, controlled line spacing, and consistent point recording.
Multi Visual Analyzer is valuable because it lets the operator analyze 3D graphs, review scan files, and visually interpret target zones. Do not dig only because one cell is red. Look for a cluster that has shape, position, and repeatability. Use Pin Pointer after Ground Scan to check the suspected location. If the scan suggests a cavity, compare the color pattern with the expected blue or light-blue logic and repeat the grid.
Gold Vision with GEOGROUND 3D Analyzer
Gold Vision combines 3D Ground Scan, Long Range, Free Mode, Smart Depth, Ionic, and Bionic systems. Its manual states that the 3D Ground Scan system works through the Smart Sensor to measure magnetic field changes caused by metallic targets or underground voids. The results are displayed in the proprietary GEOGROUND 3D Analyzer application on a supported Android smartphone or tablet.
GEOGROUND 3D Analyzer is designed to provide visual tools for analyzing the three-dimensional drawing and helping determine potential target type, shape, size, and depth. When reading Gold Vision 3D ground scan results, begin by asking whether the Smart Sensor and wireless handle were installed correctly and whether the handle rotation lock was used. The manual specifically notes the importance of locking the device rotation feature for better results.
Gold Vision also includes Smart Depth, Ionic, Bionic, and LED color indications. Use these as supporting clues. If GEOGROUND 3D Analyzer shows a possible metallic anomaly, red LED feedback or Smart Depth can help build confidence. If the scan suggests a void, blue feedback may support that interpretation. However, the scan should still be repeated and compared before excavation.
GR-4 GroundTech with G-Portal
GR-4 is a compact Groundtech 3D ground scanner using MFS-2 Dual Sensor Technology. Groundtech describes it as an advanced ground scanning and detection system for detecting underground anomalies, performing 3D analysis, and evaluating results instantly. Orient Detectors lists GR-4 as a 3D ground scanner with up to 15 meters scanning depth depending on soil and target size.
G-Portal is the app ecosystem for GR-4 and Groundtech devices. Groundtech describes G-Portal as an Android and iOS 3D/4D analysis program. The Google Play listing explains that it helps connect to Groundtech devices, manage scans, analyze underground anomalies, and view real-time 3D analysis. It includes scanning modes such as 3D Ground Scanning, Live Scanning, Pinpointer, Detector Quick Scan, and more, depending on device support.
When reading GR-4 3D ground scan results, focus on the type of anomaly. Groundtech states that its software can graphically show magnetic metals such as iron or steel and non-magnetic metals such as gold, silver, or copper, as well as void structures. Use the built-in screen for quick field feedback and G-Portal for detailed analysis, saving, and reports. If a result looks promising, repeat it and examine it from multiple views before making a decision.
OKM EXP 7000 with Visualizer 3D Studio
OKM EXP 7000 Professional Plus is a premium 3D ground scanner and metal detector. Orient Detectors describes it as using multi-sensor 3D Ground Scan and Multi-Frequency VLF. OKM’s official information lists operating modes including 3D Ground Scan, Magnetometer, Live Scan, Mineral Scan, Tunnel Scan, Pinpointer, 3D VLF Scan, and VLF Metal Detection.
OKM states that 3D Ground Scan results are displayed as 3D visualization in Visualizer 3D Studio for detailed analysis. Visualizer 3D Studio can import scan data, adjust views, rotate, scale, move, use predefined viewports, assign soil types, select measured values, apply modifiers, add bookmarks, and export PDF reports in the Professional edition.
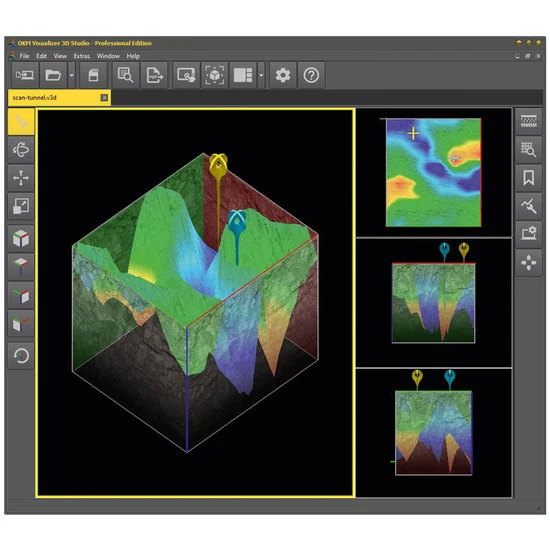
When reading OKM EXP 7000 3D ground scan results, use the software depth tools carefully. Select the correct soil type because it affects depth calculation and visualization. Use Magnetometer mode to help clean the scan area of small surface ferrous items before 3D scanning. Use Live Scan for immediate feedback, Tunnel Scan for voids, Mineral Scan for natural gold or mineralized zones, and 3D VLF Scan for field scanning with later analysis. OKM’s workflow is especially strong for documentation and professional reporting.
Reading OKM Visualizer 3D Studio Results Step by Step
Visualizer 3D Studio should be treated as an analysis desk, not just a display screen. After importing the scan, first check the scan information: field length, field width, scan direction, impulse mode, number of scan lines, and measurement points. If this field information is wrong, the displayed position, proportions, and estimated depth can also be wrong. A professional user verifies the scan setup before interpreting the colors.
The second step is soil selection. OKM’s documentation places strong emphasis on soil type because depth estimation depends on how the software models the ground. Dry sand, clay, loam, mineralized soil, and wet ground do not behave the same. If the soil setting is inaccurate, a target may appear shallower or deeper than it really is. This is why a serious report should always mention the selected soil type rather than giving a depth number without context.
The third step is view control. Rotate the scan, use side views, zoom in and out, and compare top, side, and perspective views. A target that only looks convincing from one angle is less reliable than a target that keeps a coherent shape from several views. Visualizer 3D Studio allows users to move through these views instead of relying on a single dramatic screenshot. This is one of the biggest differences between beginner and professional analysis of 3D ground scan results.
The fourth step is value selection. Use the software’s value tools to inspect the actual measured areas instead of judging only by color. A red peak may look large because of the selected scale, but the underlying value and its relationship to surrounding values matter more. This connects directly with the red-minus-blue logic explained earlier: the best reading compares a suspicious high-response area with nearby low-response values, then checks whether the contrast is strong enough to be meaningful.
The fifth step is to use bookmarks. OKM Visualizer 3D Studio documentation describes bookmarks as a way to mark important scan areas. In a professional workflow, a bookmark should not simply say “gold here.” It should record a measured observation: “compact red anomaly near scan line 5,” “possible void-shaped depression near rear-left quadrant,” or “repeat scan recommended from opposite direction.” This makes the analysis easier to review later and helps another operator understand the logic behind the interpretation.
The sixth step is modifier control. Visualizer 3D Studio includes modifiers that can change how data is displayed. These tools are useful for analysis, but they can also make weak signals look more dramatic if used carelessly. A professional user compares the original view with modified views and avoids presenting a heavily adjusted visualization as if it were raw evidence. Modifiers should clarify the scan, not replace the scan.
The final step is reporting. OKM Visualizer 3D Studio Professional can export PDF reports, which is valuable for customers, teams, and excavation planning. A strong OKM scan report should include screenshots from multiple angles, the selected soil type, scan dimensions, notable bookmarks, interpreted target category, estimated depth range, confidence level, and recommendation for confirmation. This turns the scan from a colorful image into a documented field decision.
| Visualizer 3D Studio Tool | How It Helps Read Results | Professional Caution |
|---|---|---|
| Soil type selection | Improves depth estimation and ground modeling. | Wrong soil settings can distort depth confidence. |
| Rotate, scale, move, viewport controls | Shows the anomaly from multiple angles. | Do not rely on only the most dramatic angle. |
| Measured value selection | Helps compare target response with surrounding ground. | Color must be supported by actual value contrast. |
| Bookmarks | Marks suspicious points for review and reporting. | Use objective notes, not exaggerated claims. |
| Modifiers | Can clarify shape, contrast, or visibility. | Compare modified views with the original scan. |
| PDF reporting | Creates a documented analysis for decisions or clients. | Report confidence level and confirmation needs. |
Comparison Table: Devices and Apps
| Device | Main 3D Workflow | App / Software | Best Interpretation Use |
|---|---|---|---|
| Phoenix | M.G.S and V.S.T based 3D Ground Scan, Live Stream, Pin Pointer | Multi Visual Analyzer | Fast 3D imaging, live feedback, color-coded gold/metal/cavity interpretation |
| Mega Scan Pro | V.S.T Ground Scan grid, saved scan files, Pin Pointer confirmation | Multi Visual Analyzer | Structured grid scans, 2D/3D review, target and cavity color logic |
| Gold Vision | Smart Sensor 3D Ground Scan plus Smart Depth and LED feedback | GEOGROUND 3D Analyzer | Target type, shape, size, depth estimation, metals vs voids |
| GR-4 GroundTech | MFS-2 Dual Sensor 3D scan, live scan, pinpointer | G-Portal | 3D/4D analysis, magnetic/non-magnetic target review, reporting |
| OKM EXP 7000 | 3D Ground Scan, Magnetometer, Live Scan, Tunnel Scan, 3D VLF Scan | OKM Visualizer 3D Studio | Advanced analysis, soil types, bookmarks, modifiers, PDF reports |
Common False Signals in 3D Ground Scan Results
Surface Iron
Nails, cans, wire, and small iron pieces can create strong near-surface anomalies. OKM includes Magnetometer mode on EXP 7000 partly because clearing small ferrous items before a 3D scan improves the quality of the scan.
Operator Height Changes
If the sensor rises and falls during the scan, the software may show false bands or waves. Mega Scan Pro’s manual emphasizes keeping the V.S.T height steady. This applies to every scanner: stable sensor height improves 3D ground scan results.
Wrong Soil Type
Depth and visualization can change when the wrong soil type is selected. OKM Visualizer 3D Studio specifically includes soil type selection and even allows individual soil types in advanced workflows.
Uneven Grid Walking
If one line is longer than another, or the operator turns incorrectly in zigzag mode, targets may stretch or shift. Always mark scan corners and keep scan lines parallel.
Mineralized Soil
Mineralization can produce broad color changes that look like large targets. Real objects usually have more defined shape and repeatability. Mineralized ground often looks spread out and inconsistent.
A Professional Step-by-Step Reading Method
Step 1: Confirm the scan setup
Write down area size, line count, step spacing, direction, soil type, device mode, and probe used. Without this information, interpreting 3D ground scan results becomes guesswork.
Step 2: Look at the top view first
A top view helps locate the anomaly inside the grid. Ask whether it sits near the edge, in the center, or along a scan line. Edge anomalies are often less reliable and may require a larger repeat scan.
Step 3: Rotate to side and 3D views
Side views help estimate whether the anomaly is shallow, deep, raised, or depressed. 3D views help understand shape, but they can be visually dramatic, so avoid overreacting.
Step 4: Check the color pattern
Use the device’s own color logic, not a generic rule. Phoenix and Mega Scan Pro color logic should be read differently from OKM software tools or Groundtech G-Portal views if the systems use different palettes.
Step 5: Compare with expected target physics
A treasure box, tunnel, grave, small gold object, and mineralized zone should not look identical. The shape should make sense for the target type.
Step 6: Repeat the scan
Run a control scan from the opposite direction or with a shifted grid. If the anomaly disappears, treat it with caution. If it repeats in the same position, confidence increases.
Step 7: Confirm with another mode
Use live scan, pinpointer, PI detector, VLF metal detection, smart depth, or long-range confirmation depending on the device. The strongest decisions come from multiple evidence layers.
How to Interpret Specific Target Types
Metal Targets
Metal usually appears as a positive anomaly, often raised or warm-colored depending on software. But iron mineralization can imitate metal, and large surface trash can dominate a scan. Use pinpointer, magnetometer, or detector mode to test whether the signal behaves like metal.
Gold and Precious Metals
Some systems provide gold-specific colors or target classifications, such as Phoenix and Mega Scan Pro showing red for gold or large metal target. Treat this as an indication, not final proof. Gold identification from 3D scans should be confirmed with another system whenever possible.
Cavities and Voids
Voids often appear as low-response or blue-toned anomalies depending on the app. A tunnel should have length and direction. A room may appear as a broad structured depression. Random blue patches can be caused by poor scanning or soil variation, so repeat and cross-check.
Disturbed Soil
Disturbed soil may create an anomaly even without a metal object. This can be useful when looking for graves, buried chambers, old pits, or filled tunnels, but it requires cautious interpretation.
Natural Mineralization
Natural mineralization can create color shifts and broad patterns. It often lacks clear boundaries. Use a control scan nearby in similar soil to understand the background response.
Best Practices for Reporting Scan Results
A professional report should include the device, app or software, date, location notes, scan area dimensions, scan line count, step spacing, direction, soil type, mode used, weather or moisture notes, images of the scan from several views, and a written interpretation. OKM Visualizer 3D Studio Professional supports PDF reporting, bookmarks, scan information, and soil data. G-Portal also supports saving scan data and reviewing analysis in more detail.
For Phoenix and Mega Scan Pro, save scan files when possible and keep screenshots of the Multi Visual Analyzer views. For Gold Vision, document GEOGROUND 3D Analyzer output and any Smart Depth or LED feedback. For GR-4, save the G-Portal analysis and compare 3D/4D views. Documentation prevents confusion later and helps compare repeated scans.
FAQ: 3D Ground Scan Results
Can 3D ground scan results identify gold with certainty?
No. Some devices use gold-related colors or target categories, but professional users treat these as indications. Confirm with repeat scans and another detection mode before excavation.
Why do two scans of the same area look different?
Different walking direction, probe height, soil moisture, scan line spacing, start point, and operator movement can change the image. That is why control scans are important.
What color means a cavity?
It depends on the device. Phoenix and Mega Scan Pro commonly use light blue or blue for small cavities or larger voids. Other software may use different visualization palettes, so always check the device manual.
Which app is best for professional scan analysis?
It depends on the device. Phoenix and Mega Scan Pro use Multi Visual Analyzer. Gold Vision uses GEOGROUND 3D Analyzer. GR-4 uses G-Portal. OKM EXP 7000 uses Visualizer 3D Studio, which is especially strong for detailed desktop analysis and reporting.
Should I dig after one strong 3D scan?
Usually no. Repeat the scan, check the target from another direction, and confirm with live scan, pinpointer, PI, VLF, or another relevant system.
Final Verdict
Professional interpretation of 3D ground scan results is a disciplined process. It is not about believing the most colorful image. It is about clean scanning, correct settings, device-specific color logic, repeated measurements, cross-checking, and documentation.
Phoenix is strong for fast 3D imaging with M.G.S, Live Stream, Pin Pointer, and Multi Visual Analyzer. Mega Scan Pro is strong for structured V.S.T grid scanning, scan files, 2D/3D analysis, and confirmation through Pin Pointer and other systems. Gold Vision is useful for users who want GEOGROUND 3D Analyzer, Smart Sensor scanning, Smart Depth, and LED color feedback. GR-4 is a compact modern scanner with MFS-2 dual sensor technology and G-Portal 3D/4D analysis. OKM EXP 7000 is the premium professional platform for multi-mode scanning and detailed Visualizer 3D Studio analysis.
The best users do not ask software to make the decision for them. They use software to organize evidence. If the scan is clean, the anomaly is repeatable, the shape makes sense, the depth estimate is reasonable, and another system supports the result, then the data becomes actionable. That is how professionals read 3D scans: not as promises, but as structured evidence leading to better field decisions.
Suggested Links
Suggested External Links
Resources
- Orient Detectors: Phoenix
- Orient Detectors: Gold Vision
- Orient Detectors: GR-4 GroundTech
- Orient Detectors: Mega Scan Pro
- Orient Detectors: OKM EXP 7000
- OKM: eXp 7000 Professional Plus
- OKM: Visualizer 3D Studio
- OKM Detectors: Visualizer 3D Studio documentation
- Groundtech: GR-4
- Google Play: Groundtech G-Portal
- Mega Locators: Mega Scan Pro